In agile product development, Product Owners often face a growing list of feature ideas. Story points are assigned, effort is discussed, and the roadmap extends across multiple sprints. Yet one key question often remains unaddressed: What financial risks are associated with each feature, and what are the consequences if estimation errors accumulate over time?
A quantitative, objective perspective is rarely part of these conversations. Stakeholders often advocate for their own priorities and immediate interests, while the broader financial context is overlooked. The central challenge is clear: How can teams move beyond intuition and competing interests to achieve data-driven clarity in planning? Spreadsheets exist for this kind of analysis, but they can feel cumbersome and inflexible during collaborative refinement sessions.
This gap inspired an experiment: Can simple simulations make financial risks and opportunities in agile product development more transparent? The aim is not to create a comprehensive toolkit, but to identify practical approaches that support everyday decision-making. The methods and insights are shared openly—not as definitive answers, but as an invitation to further discussion and critical reflection. Sometimes, quantitative analysis provides clarity; other times, it highlights new questions. Ultimately, what matters is which approaches prove effective under the pressures of real-world teams.
This approach integrates agile delivery with financial risk management. In finance, risk is quantified using tools such as expected value, worst case, Value at Risk (VaR) and Conditional Value at Risk (CVaR), which provide a structured foundation for decision-making. Most metrics in this model are adapted from finance and renamed for product management purposes. The primary innovation is the Business Value Floor 95, which reframes VaR as a downside guarantee for stakeholders: “we keep at least X of value in 95% of scenarios.” An additional dimension, not typically addressed in finance, sits alongside it: the Likelihood of Non-Completion (LLP), which measures the probability that a feature never reaches production — delivery risk rather than value risk. Full definitions are available in the project glossary. Incorporating these tools into the backlog enables teams to make evidence-based decisions rather than relying on intuition. Previous work in software, such as Waltzing with Bears and the Atlantic Systems Guild’s riskology Excel sheet, also supports this direction. Although these tools may feel oversized for daily backlog work, the underlying concepts remain valuable.
This project explores whether Product Owners and teams can use quick simulations—on their own or together in refinement—to better understand financial risks, opportunities, and worst-case scenarios. Especially when budgets are tight, this approach draws on experience, rough estimates, and historical data to make risks more visible. Whether such simulation is helpful or practical in everyday agile practice remains an open question—one that invites exploration and debate.
How Business Value Is Measured Here
Business value is not a fixed figure; it varies based on the targeted improvement and the system type. This approach uses a straightforward model for customer-facing features:
business value = users × conversion rate × value per conversion
This formula is suitable for customer portals, e-commerce platforms, and similar systems where conversion is a key metric.
For internal tools, the formula maintains the same structure but uses different input variables — for example time saved per task and labor cost, or events prevented and the cost of each failure:
business value = tasks × time saved per task × labor cost (internal tool — time savings)
business value = events × failure-rate reduction × cost per failure (internal tool — failure prevention)
The simulation is parameter-agnostic and adapts to the chosen units. Additional examples and details are available in the Notebook 02 reading guide for measuring value. This approach uses a single model for clarity, but other system types may require different input variables; the resulting outputs remain comparable for decision-making. The objective is not to achieve absolute precision, but rather to estimate realistic ranges and use simulation to evaluate the robustness of decisions under uncertainty.
Whether the backlog includes customer features, observability tasks, internal tools, or compliance items, the model evaluates them using the same approach.
A Vibe Project: Exploring Financial Risk Simulation
This open project also serves as a proof of concept for a fully generated core of a financial application. Rather than relying on spreadsheets, the approach demonstrates how a Python-based kernel—developed with AI-generated unit tests and domain-driven design principles—can provide a reusable foundation for financial risk simulation across various applications. This architecture supports both educational exploration and integration into larger systems, moving beyond ad hoc Excel-based solutions.
A distinctive feature is the inclusion of a fully AI-generated architecture documentation following the arc42 standard. This documentation is available as structured text, with an interactive HTML canvas and visual models created with draw.io. These resources provide a transparent, reproducible blueprint for the project’s architecture and demonstrate how automated documentation and modeling can be integrated into modern, simulation-based software development.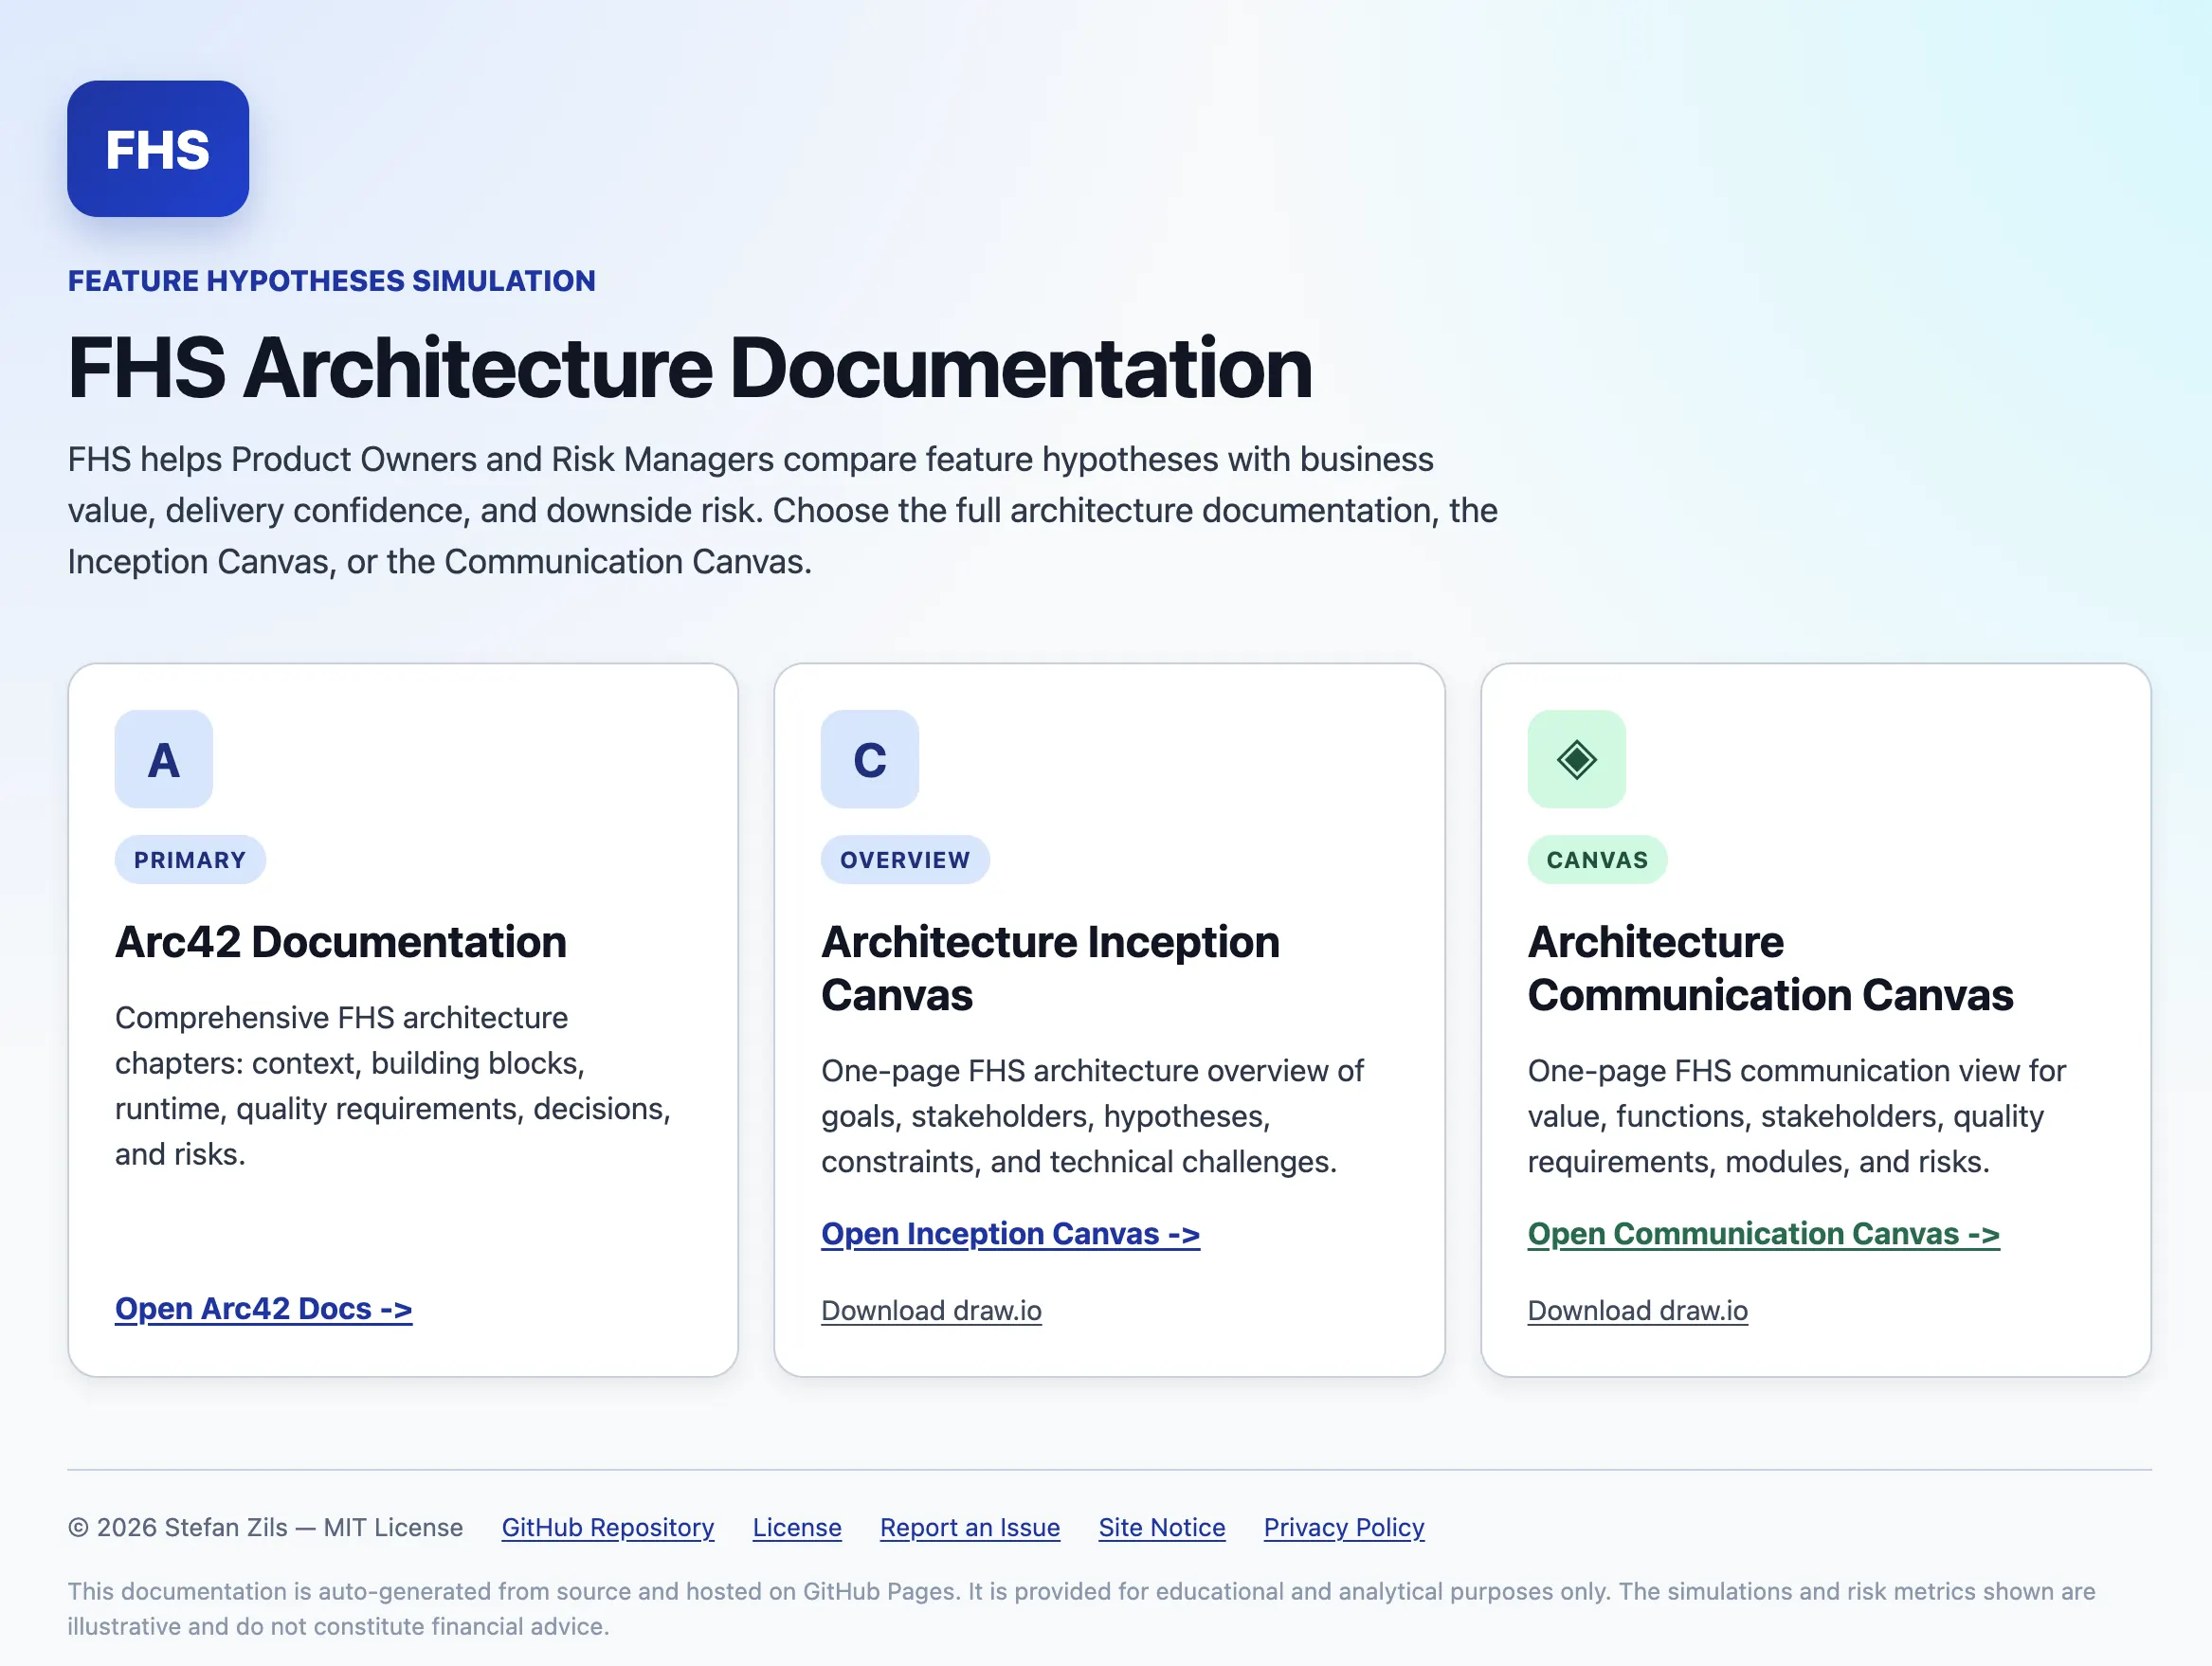
Product Owner Case Study: Decision Path Overview
This open case study demonstrates how Product Owners can use simulation to make financial risks and opportunities visible in agile planning. The core of the study is a transparent, six-step decision path—each step supported by a Jupyter notebook and a detailed reading guide. The model defaults to 10,000 Monte Carlo scenarios per feature hypothesis; the case study itself was run with 100,000 scenarios to stabilise the tail estimates that VaR and CVaR depend on. The structure empowers teams to move from gut feeling to data-driven decisions across multiple sprints.
| Step | Key Question | Notebook | Reading Guide | Post |
|---|---|---|---|---|
| 1 | What value can each feature provide? | 02 — Business value | 02 — Business value | Business Value |
| 2 | Does the investment pay back over time? | 03 — Financial return | 03 — Financial return | — |
| 3 | Which feature bundle fits the budget best? | 04 — Portfolio and budget | 04 — Portfolio and budget | — |
| 4 | Which risk layer removes the most value? | 05 — Risk resilience | 05 — Risk resilience | Risk Resilience |
| 5 | Will development stay inside the budget? | 06 — Development cost risk | 06 — Development cost risk | Development Risk |
| 6 | What is the final roadmap recommendation? | 07 — Executive decision | 07 — Executive decision | — |
The Product Owner Case Study offers a concise overview with real charts—no setup required. It highlights the pivotal moments Product Owners face when applying simulation to feature evaluation and prioritization:
- A clear six-step decision path, from estimating business value to making an executive recommendation.
- Each step paired with a focused Jupyter notebook covering value, return, budget, risk, and the final roadmap.
- A way to move teams beyond intuition and stakeholder dynamics, towards transparent, data-driven feature planning across multiple sprints.
- A foundation for the deeper walkthroughs I plan to publish in future posts.
Together, this gives Product Owners and agile teams a practical, repeatable framework for financial clarity and risk-aware planning throughout the delivery cycle.
All materials, source code, and documentation are openly available on the project’s GitHub Pages site. The repository README provides an entry point, with further technical details in the library reference.
Read Next
This post introduces the overall approach. The follow-up posts unpack selected parts of the decision path.
Business Value — the first follow-up post, focused on how value is modelled for feature hypotheses.
Risk Resilience — Notebook 05: standard portfolio risk plus the Likelihood of Non-Completion (LLP) layer finance does not have.
Development Risk — Notebook 06: Sprint cost overrun, cancellation gates, and budget pressure in refinement.
Agile Increment — measuring business value — earlier background on measuring value in agile delivery.
The remaining notebooks and reading guides stay available in the public case study for financial return, portfolio and budget, and executive decision-making.
Project Links and References
Project Links
- Documentation site: FHS documentation site
- GitHub repository: feature-hypotheses-simulation-public on GitHub
- Repository README: project overview and getting started
- Product Owner Case Study: six-step decision walkthrough
Background References
- Book: Waltzing with Bears: Managing Risk on Software Projects by Tom DeMarco & Timothy Lister (Dorset House, 2003; ISBN 978-0-932633606)
- Riskology spreadsheet: The Atlantic Systems Guild — Riskology