The Feature Hypotheses Simulation (FHS) uses a simple formula to measure the value of information within an information system. This formula applies to both commercial systems such as customer portals, e-commerce platforms, and public APIs, as well as internal systems including employee portals, internal tools, and compliance dashboards. The factors can be adapted based on the specific information system.
business value = users × rate × unit value
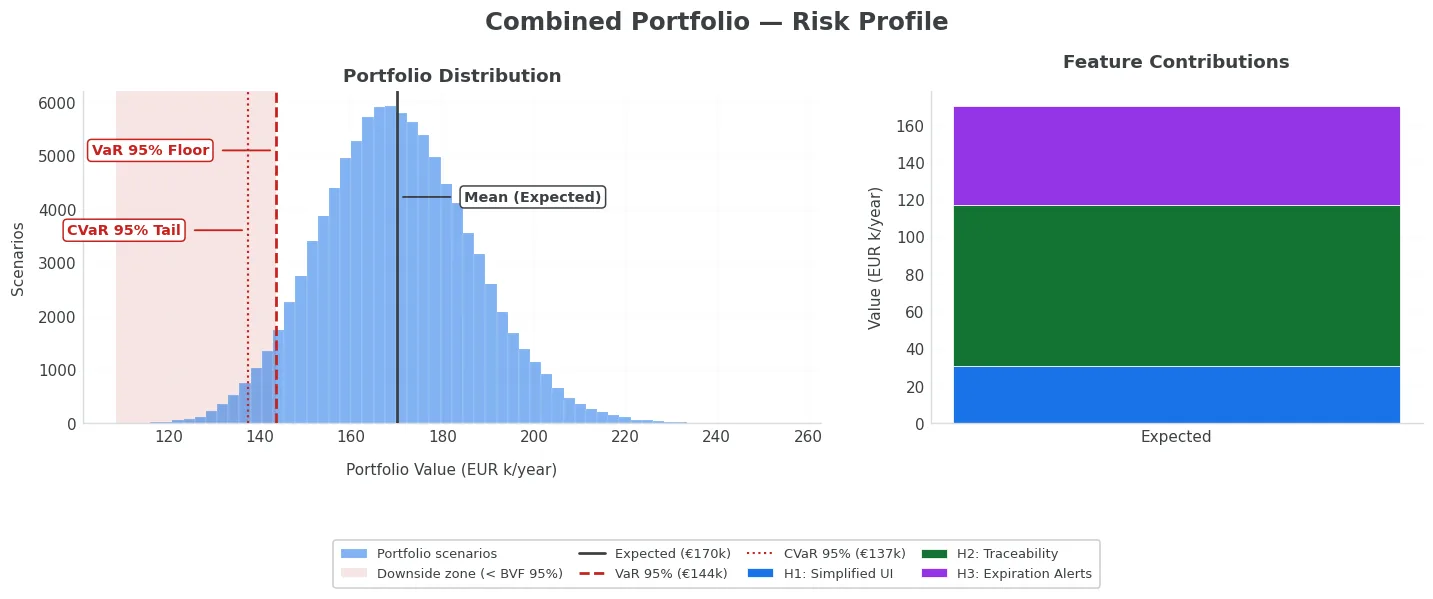
The model simulates over 100,000 possible outcomes. According to the law of large numbers, such a large sample closely approximates real-world scenarios. It is essential to incorporate historical data and their standard deviations into these calculations. The Business Value Floor 95 concept addresses the lowest 5% of business value outcomes. This approach is analogous to the Value at Risk concept from finance, but here the emphasis is on reliably achievable value rather than potential loss.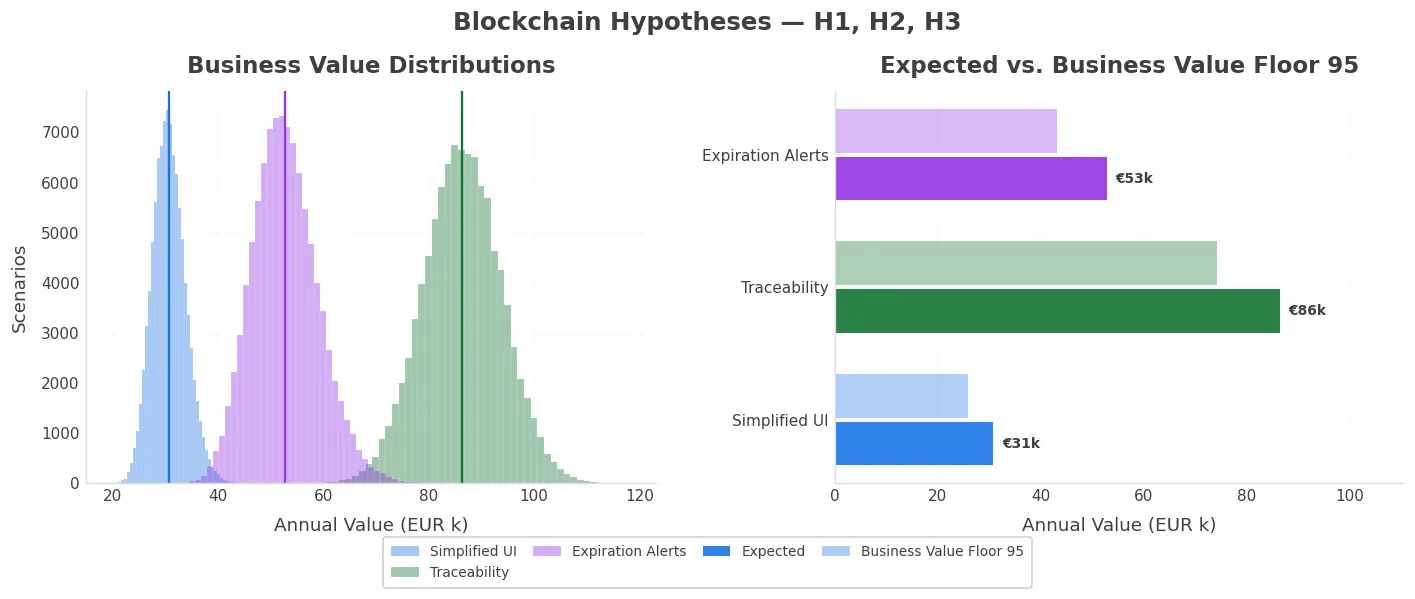
Wertbildungsrechnung — Utility Before Profit
A business does not have to focus exclusively on maximizing profits. The German drugstore chain dm, for example, has maintained financial success since the early 1990s. This success comes from adhering to the principle of “utility before profit”. The idea was articulated by its founder, Götz W. Werner, and realized through Wertbildungsrechnung (value-formation accounting). The primary aim is to create value for customers, employees, and society.
This approach seeks to illustrate a company’s value creation. Branch employees can assess individual services along the value chain. For example, they evaluate the performance of internal logistics, accounting, and IT at each location. In addition, this method aims to assess other contributions by the company. These include taxes, social activities, donations, and employee contributions.
Team Topologies — Platform and Enabling Teams
In software development, some teams and experts provide services throughout the delivery process that lack a clear, measurable value to the process. Team Topologies identifies these as enabling teams and platform teams.
- Platform teams create and manage tools or systems that other teams use, such as internal developer websites, automated testing and delivery systems, systems to monitor how software is working, and shared code libraries.
- Enabling teams are made up of software experts and coaches. They provide sample designs, example projects, clear advice, and support to help other teams learn new ways of working.
Both types of teams share a similar economic profile. Their contributions are realized over time. Value is generated through repeated reuse across the organization. Often, the impact is not immediately measurable. For example, Amazon Web Services required years to achieve profitability. In some cases, such as coaching engagements, benefits cannot be directly attributed. Product Owners or organizations typically ask how many teams will adopt a solution, over what timeframe, and what capability, quality, or velocity improvements can reasonably be expected.
It is possible to estimate the impact of small changes by platform teams or software architects, which may be easier to assess. Predicting the outcomes of significant innovations and approaches remains challenging.
Public-Good Contributions
How do we value contributions to open source? An organization might release its internal software as open source, or support strategic open-source projects such as Linux.
- Google developed Kubernetes and Chromium, from which every cloud provider and every browser — including direct competitors — benefits.
- Microsoft develops and maintains Visual Studio Code, used without charge by millions of developers across platforms.
- LinkedIn open-sourced Apache Kafka, now the de facto backbone of streaming-data infrastructure at thousands of organizations.
Traditional accounting methods do not fully capture the value these software contributions generate in financial reports. A Harvard Business School working paper estimates the global demand-side value of open source at approximately $8.8 trillion, which is three orders of magnitude greater than the $4.15 billion supply-side cost to create it. Kubernetes has given rise to an industry of distributions, managed services, and consultancies, while Chromium underpins every major non-Apple browser.
While these contributions generate significant value for the community, contributing organizations also gain advantages such as attracting skilled talent, influencing standards, improving software quality, and enhancing their reputation. However, these benefits are difficult to quantify without direct financial value streams, and this aspect of the return is not captured by the simulation.
Limits of a Monetary Scale
The approach provides a practical way to simulate business value for stakeholders of any information system development. Business value includes any measurable organizational outcome. While monetary values are most effective for financial analysis, optimization should also consider time, resource, and CO₂ savings through green IT.
Most decision-makers pay particular attention to monetary outcomes, as these are central in both internal and public reporting. When comparing initiatives, the discussion often centers on costs, risks, and potential downsides. This focus can make it harder to recognize and appreciate the benefits of new opportunities. As a result, organizations tend to prioritize reducing risks and costs, while projects that could open up new possibilities sometimes receive less support.
Organizations experiencing ongoing cost pressures can benefit from adopting this approach. The simulation toolkit helps make trade-offs clearer and sets realistic minimum targets. However, its limits become obvious in unusual or innovative cases — products like the Macintosh, Amazon Web Services, or Post-it Notes might not have survived a strict review focused only on risks and costs when they were first introduced.
Simulation can increase decision-making confidence. However, it cannot replace expertise in high-risk entrepreneurial ventures or ongoing project management.
Information
Reading guide — Notebook 02: Business Value
Executable notebook: 02-blockchain-case-study.ipynb
GitHub repository: feature-hypotheses-simulation-public
Product Owner Case Study: six-step decision walkthrough
Wertbildungsrechnung (DE): Werkstatt für Kollegiale Führung
Götz W. Werner — autobiography: Womit ich nie gerechnet habe (List Taschenbuch / Ullstein, 2015; ISBN 978-3-548-61254-6)
Value of open source software: Hoffmann, Nagle & Zhou, The Value of Open Source Software (Harvard Business School Working Paper 24-038, 2024)
Macintosh: Mac (computer) — Wikipedia
Amazon Web Services: Amazon Web Services — Wikipedia
Post-it Notes: Post-it note — Wikipedia
Related post: Feature Hypotheses Simulation
Related post: Agile Increment — measuring business value